The Weekly Report For April 25th - April 29th, 2011 Commentary:The market pulled quite the “shake and bake” move this week as it gapped under last week's lows and then reversed to eclipse last week's highs a few days later. The markets continue to frustrate bears and this week’s sudden reversal has bear trap written all over it. With many expecting last week's lows to hold, this week’s gap down surely forced some bulls to stop out and likely also tempted more bears into shorting the drop. However, the markets were already starting to get oversold again, making the down move unsustainable. Tutorial: Technical Analysis The S&P 500, as represented by the S&P 500 SPDRS (NYSE:SPY), had a very sharp reversal gap on Wednesday and is now back near the very important resistance level of $134. Thus, technically speaking, SPY is not out of the woods yet. However, this week’s strength surely has some bears on edge, and any dip into the unfilled gap near $132 should bring in buyers who missed this week's turn. The lows near $130 are now very important levels to watch for swing traders. | 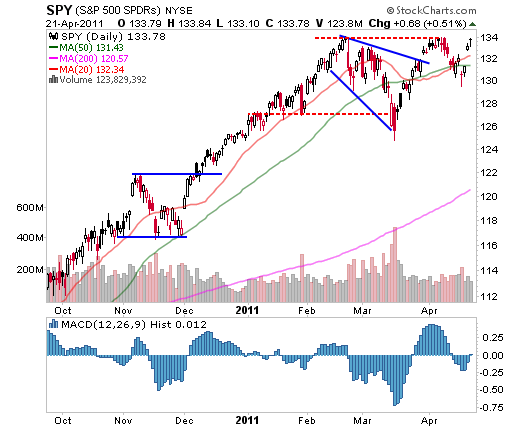
| | Source: StockCharts.com | The Diamonds Trust, Series 1 (NYSE:DIA) ETF actually managed to set new multi-year highs this week after threatening to break down just a few days earlier. DIA held support at its 50-day moving average and lateral support near $122. This area can now be considered a key support level. Like SPY, there is now a fairly large breakaway left behind and the markets tend to fill these gaps over time. However, gap fills are not guaranteed, and there is a similar gap as recently as December that has remained untouched. That being said, the chances are that DIA will find buyers waiting near the gap on any weakness. (For more, see Playing The Gap.) | 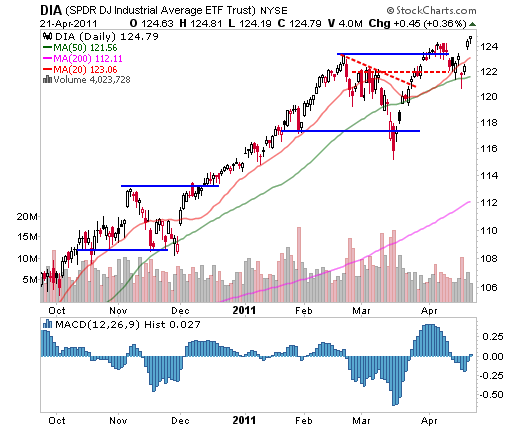
| | Source: StockCharts.com | Last week we mentioned a possible inverse head-and-shoulders pattern developing in the Powershares QQQ ETF (Nasdaq:QQQ). With this week’s reversal, SPY broke a trendline that was marking the top of this pattern. QQQ was helped by a post-earnings move higher in Apple (Nasdaq:AAPL). While QQQ still has a key resistance level above $59, the measured move for this pattern projects to a target of $61-$61. (For more, see Tales From The Trenches: Don't Count On Luck.) | 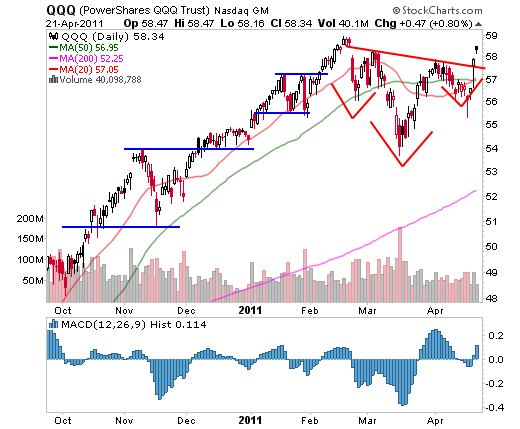
| | Source: StockCharts.com | The iShares Russell 2000 Index (NYSE:IWM) ETF provided us with a subtle clue this week. Notice that this week's low barely broke under last week's lows before reversing. This is a clue that IWM is showing some relative strength and while IWM didn’t surge to new highs, it remains in a healthy pattern. It bodes well for the markets that QQQ is showing a promising pattern and that IWM is showing hints of relative strength. | 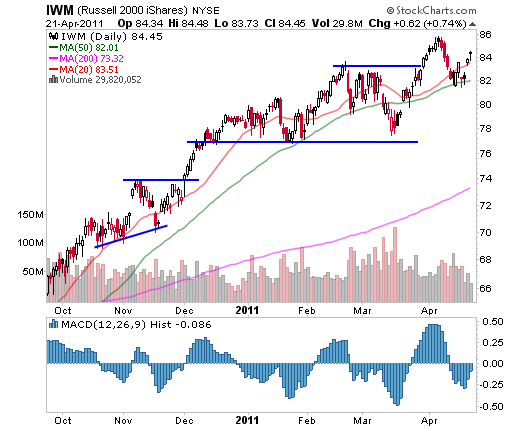
| | Source: StockCharts.com | The Bottom Line
We hypothesized last week that a push to new lows would imply further downside, but the gap down on Monday merely served to shake out some bears. While this week’s reversal has been impressive, it’s no small coincidence that SPY closed right at its recent highs. With another full week of earnings on tap, the reactions to the reports will dictate the next move. However, this week’s strength is working to clear up the picture, giving traders some well-defined areas to watch. In the end, that’s the most we can ask for. (For more, see Analyzing Chart Patterns Tutorial.)
Use the Investopedia Stock Simulator to trade the stocks mentioned in this stock analysis, risk free! |


0 komentar:
Posting Komentar