Commentary: One of the most predictable trading setups is the post-breakout “pull back to support”. While this pattern doesn’t occur on all breakouts, it is quite common. Typically, a stock undergoes a consolidation prior to a breakout during which clear levels are defined where sellers outnumber buyers and vice versa. Once a stock breaks free of the consolidation, many stop orders are triggered and participants who are late to the trade rush in. After the initial breakout, the stock will often drift back to its prior base as some traders take profits and new short sellers fade the breakout.
Tutorial: Technical Analysis Once the stock drops back to its prior base, it will often find buyers who either missed the original breakout or short sellers eager to cover near their prior entries. Again, while this doesn’t work every time (some stocks do fail their breakouts and completely reverse), it is fairly common and makes sense when you think of the psychology behind the setup. Walter Energy (NYSE:WLT) is a stock that is currently following this pattern. It cleared a couple of important resistance levels recently as it broke above the channel it was following in March and then followed up with a breakout to new highs in April. It has now come back to a prior resistance level near $130 and could find eager buyers waiting in what remains a healthy chart. (For more, see Channeling: Charting A Path To Success.) | 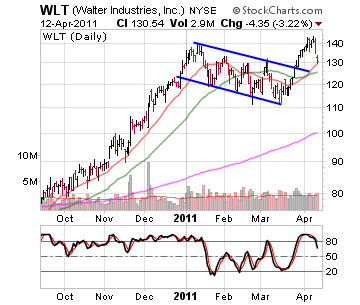
| | Source: StockCharts.com | CGI Group (NYSE:GIB) also recently cleared a base by breaking out above the $21 level. After a quick run to $22, GIB drifted back toward the prior breakout level and is currently sitting on its 20-day moving average. GIB could find some buyers in this area and traders should keep an eye out to see if it can stay above the prior base. If it finds support in this area, it could rebound and trade to new highs. | 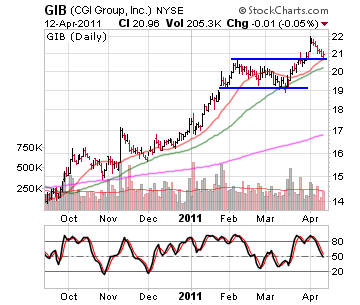
| | Source: StockCharts.com | While the iShares MSCI Emerging Index Fund (NYSE:EEM) ETF is not a stock, it is important to note that the pattern can easily be applied to any market instrument as it is based on human behavior. EEM broke above the $48 level in late March and cleared a solid base in the process. It is now pulling back to test this level and could find some support. The pullback is a little steep, so it may take a few days for this level to sort itself out. However, if EEM holds up here, it is worth watching for a possible resumption of the breakout. | 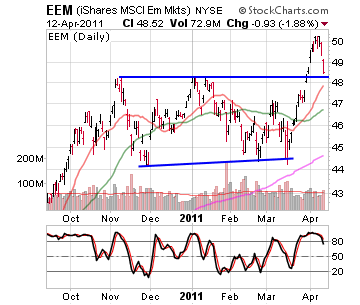
| | Source: StockCharts.com | Calgon Carbon Corporation (NYSE:CCC) is another stock that recently cleared a base and then pulled back to support. In the case of CCC, it pulled back to $16 and quickly found buyers laying in wait. It has already rebounded to its prior high and is worth watching for a possible push to new highs. | 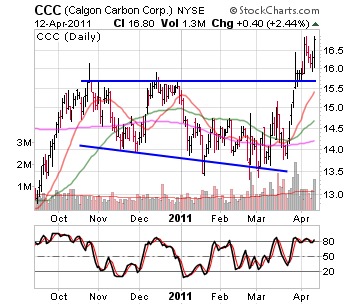
| | Source: StockCharts.com | The Bottom Line
Much like with any trading pattern, traders cannot fall prey to the notion that a stock will act predictably all the time. However, the pullback to support after a breakout is fairly predictable and often offers the safest entry into a stock that is breaking out. Once a stock in this pattern finds support near the prior breakout area and turns higher, it also provides traders with a good level for placing a stop loss order that minimizes the risk associated with the trade. (For more, see The Anatomy Of Trading Breakouts.)
Use the Investopedia Stock Simulator to trade the stocks mentioned in this stock analysis, risk free! |


0 komentar:
Posting Komentar