Commentary: One of the benefits to reviewing hundreds of stock charts each night is that I can often see patterns developing across multiple charts that provide insight into where the markets are. One of the current themes I am seeing develop across multiple sectors is that many stocks are close to testing the top of their current bases. This is interesting because the major index ETFs are lagging this price action. This could be due to certain component stocks underperforming, or even a rotation into certain sectors. Price action in individual stocks, especially when seen across a large number of stocks, will often act as a leading indicator for the indexes. If this is the case, then it’s possible that the markets will be testing their recent highs soon. Tutorial: Technical Analysis IDT Corporation (NYSE:IDT) is a stock that has been testing the $29 level for months as it works on a consolidation. It attempted a breakout a few days ago that failed. However, the reversal has not followed through and if the markets show any strength whatsoever, it could finally allow IDT to clear its base. On the downside, aggressive traders should keep an eye on the low set a few days ago just under $27, with longer term traders keeping an eye on the bottom of the base. | 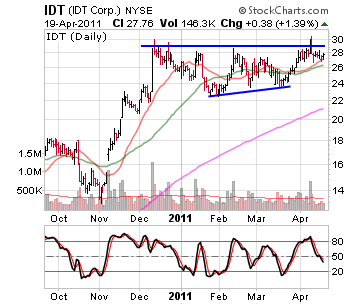
| | Source: StockCharts.com |
Fiserv (Nasdaq:FISV) is another stock that is consolidating in a tight range near the top of its base. FISV has been trading in a wide base between $58 and $64 for several months, but the consolidation may be near an end. FISV has settled down and is now being confined to a one-point range between $62 and $63. If FISV can clear this tight range, it should lead to a breakout above the entire base. | 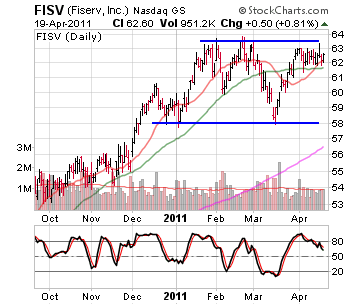
| | Source: StockCharts.com |
Dover Corporation (NYSE:DOV) is another stock exhibiting this pattern. DOV had been consolidating since breaking out early in the year. It had a shakeout in March that quickly reversed back into the base, setting the stage for an eventual breakout. Another positive is that after declining for most of April, DOV reversed course and erased most of the losses in a single day. The top of the base near $67.50 is the level to watch here; a break above this level would take DOV to all-time highs. | 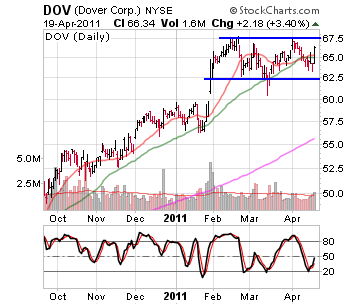
| | Source: StockCharts.com |
Luxury Jeweler Tiffany & Co. (NYSE:TIF) is also trading in a tight range just under the top of its base and at all-time highs. The trading action has been quite volatile over the past few months, especially in March. However, despite the volatility, TIF is actually trading in a well-defined base and is testing an important resistance level near $65. If TIF can clear this area, it could trigger a flood of buy stop orders. | 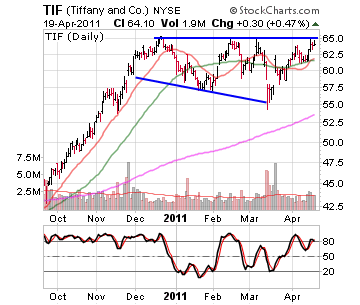
| | Source: StockCharts.com |
The Bottom Line
With even more charts trading in a similar pattern, it’s possible that the indexes will follow suit in the coming days or weeks. If the markets do show some strength in the near term, then these stocks could clear their current bases. However, traders should remain patient and let these patterns develop. If the stocks reverse near these resistance levels as the markets also show weakness, then all bets are off.
Use the Investopedia Stock Simulator to trade the stocks mentioned in this stock analysis, risk free! |


0 komentar:
Posting Komentar