Commentary: With the markets running to new highs earlier this week, it’s no surprise that many individual stocks are also moving higher. When scanning the list of stocks that have been acting well, one group has been at the forefront for weeks now. The retail group has had some great breakouts in many individual stocks such as TJX Companies (NYSE:TJX ), Buckle (NYSE:BKE) and Bed Bath & Beyond (Nasdaq:BBBY). Following their lead are other retail stocks that appear poised for some upside if the markets continue to move higher. Tutorial: Technical Analysis Ross Stores (Nasdaq:ROST), for example, is pressing up against the top of its current base and looking strong. The $73 level has been holding this stock back for several weeks, but ROST is showing some strength with the latest pullback only retracing about half of its previous range. Notice how buyers stepped in near $70 despite ROST dipping under its 50-day moving average. Traders should watch this level for support on any weakness; a close above $73 would be bullish and signal a probable breakout. (For more, see Support And Resistance Zones.) | 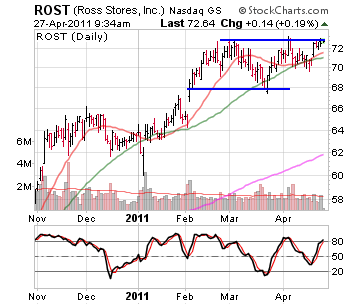
| | Source: StockCharts.com | Ascena Retail Group (Nasdaq:ASNA) is another retail stock that has been acting well. ASNA cleared a small base in March and settled into a second consolidation just above this prior base. ASNA has refused to drop into the prior base and is starting to trade in a very tight range near $33. A breakout above this range would put ASNA at new all-time highs. | 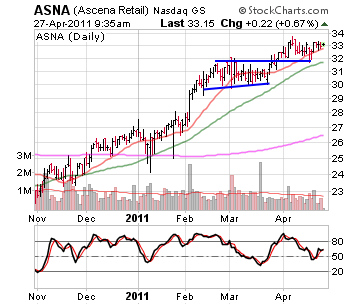
| | Source: StockCharts.com | Abercrombie & Fitch Company (NYSE:ANF ) is a stock that had a strong breakout earlier this month but could be setting up for a continuation move higher. It broke out of a base on huge volume a few days into April and has been trading in a tight bull flag pattern. This is among the most bullish of continuation patterns. A breakout above the flag may lead to a test of its all-time highs in the mid $80s. | 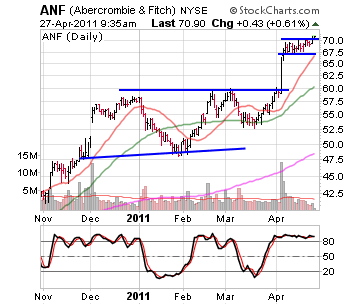
| | Source: StockCharts.com | Jos. A. Bank Clothiers (Nasdaq:JOSB) is also setting up for a possible continuation move after a prior breakout. JOSB broke out of a cup-and-handle/saucer base in late March and has been flagging above the base since then. It just started to emerge above the flag and is trading at all-time highs. (For more, see The Anatomy Of Trading Breakouts.) | 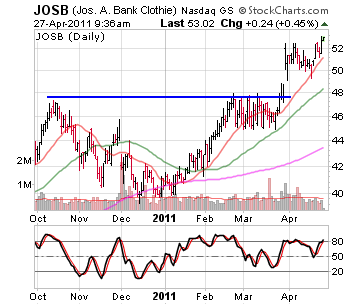
| | Source: StockCharts.com | The Bottom Line
The strength in the retail sector has been broad and this is a fairly obvious clue that institutions are involved with this group. Traders should usually trade in the same direction as the institutions, as their size will often dictate the direction in which a stock moves. Because institutions also trade in baskets of stocks across a sector, traders should always stay in tune with an individual stock’s peers. The retail sector has many individual stocks acting in unison, so traders should definitely have this group in their sites. (For more, see Top 7 Technical Analysis Tools.)
Use the Investopedia Stock Simulator to trade the stocks mentioned in this stock analysis, risk free! |


0 komentar:
Posting Komentar