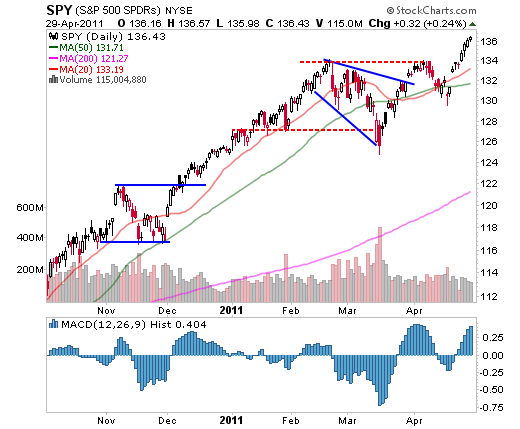
The Weekly Report For May 2nd - May 6th, 2011 Commentary: After last week's bear trap was set, the market slowly applied pressure to the bears by logging four straight positive days to close out the week. When the past two weeks are taken into account, the general markets have really been positive almost every single day and have pushed to multiyear highs. There can’t be any doubt that the markets have broken out of their prior bases and other than the low volume, the markets are showing impressive strength. The markets are already overbought though, and as exciting as a new highs is, traders need to remain patient and stick to their trading plans. Tutorial: Basics Of Technical Analysis The S&P 500, as represented by the S&P 500 SPDRS (NYSE:SPY), distanced itself from the $134 level, which was holding it back since February. Now that SPY has broken this level, it should act as support on any weakness. This would be the first level to watch if the markets stall out, but the unfilled gap below near $132 is also worth noting. If the markets were to pull into this area for some reason, it would be a prime area for potential buyers to be lurking. | 
| | Source: StockCharts.com |
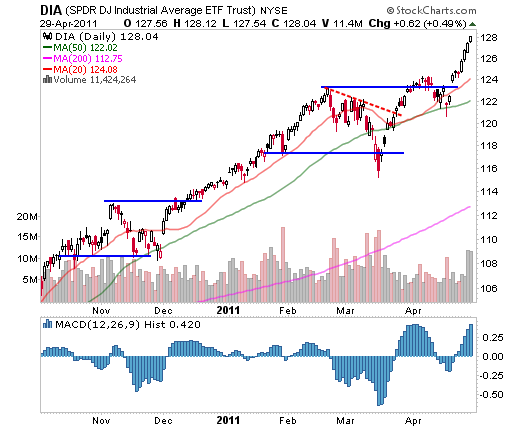
The Diamonds Trust, Series 1 (NYSE:DIA) ETF had already set new multiyear highs last week, and it extended those gains this week. The rise in DIA has been nearly vertical over the past two weeks and is due to some regression. Traders should be very leery of chasing DIA after such a strong run. Looking below, the $124 level is a likely area of support on any weakness, although there are also no guarantees it will get there. | 
| | Source: StockCharts.com |
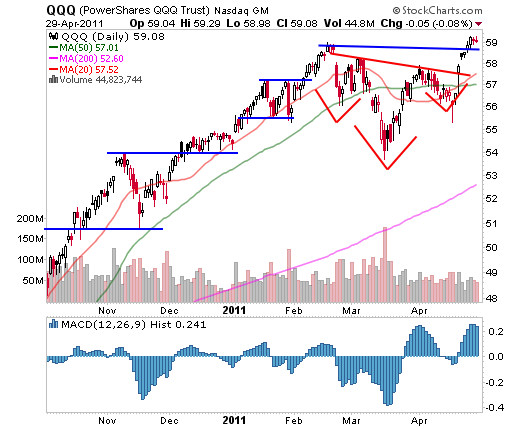
The Powershares QQQ ETF (Nasdaq:QQQ) ETF followed through on the reverse head and shoulders breakout by also clearing its highs for the year. This also puts QQQ at new 10-year highs thanks to a little help from critical ETF components Apple (Nasdaq:AAPL) and Google (Nasdaq:GOOG). While QQQ is overbought, it is not quite as extended as SPY and DIA. If QQQ can consolidate in this area, combined with a rebound in AAPL and GOOG, it could present a great opportunity. | 
| | Source: StockCharts.com |
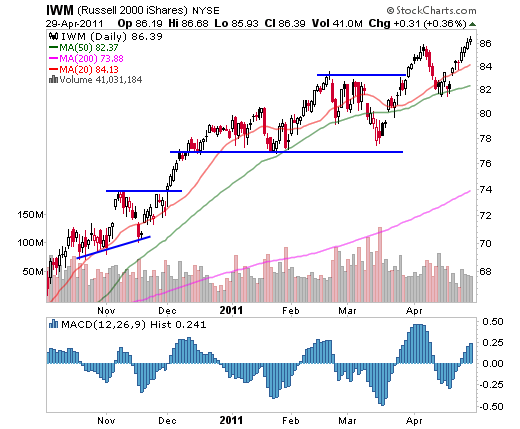
While at first glance the move in the iShares Russell 2000 Index (NYSE:IWM) ETF doesn’t look all that impressive, IWM did come close to notching a 3% gain. It also joined QQQ in clearing its prior bull market highs. This actually puts IWM at new all-time highs, although it is also the most recent issue (it started trading in 2000). IWM is also starting to get extended and it has only marginally cleared its April highs. This means that if the markets show any weakness this week, IWM is likely to drop below those April highs. However, IWM should have pretty good support down near the $84 level, which coincides with its 20-day moving average and its February highs. | 
| | Source: StockCharts.com |
The Bottom Line
IWM is the second of the four major market ETFs to clear prior bull market highs. While SPY is probably the best benchmark for classifying the overall market, IWM does represent 2,000 stocks and is a key ETF despite being the least popular of the four. The move to all-time highs is not trivial and traders need to respect that strength. That being said, the markets are clearly extended on shorter time frames and traders need to be very careful about chasing breakouts here. The markets are vulnerable to a shakeout as we enter the period where trading volume starts to taper off. As the age-old axiom, “sell in May and go away” begins to be raised more frequently, it will be interesting to see what the markets do now that they have broken out of their recent bases.
Use the Investopedia Stock Simulator to trade the stocks mentioned in this stock analysis, risk free! |


0 komentar:
Posting Komentar