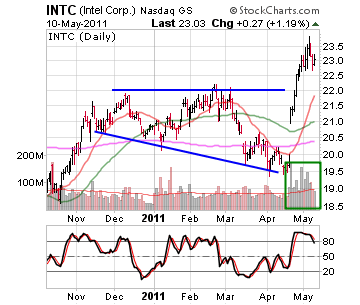
Commentary: On April 20, Intel Corporation (Nasdaq:INTC) gapped higher after reporting earnings and guidance that pleased investors. A few days later, INTC was able to clear a significant resistance level near $22 that had been holding it back for several months. INTC continued to surge, even as the general markets struggled in the first few days of May. The strong price action has also been accompanied by a surge in volume, signifying that the move is being driven by institutions. While INTC remains in a several-year sideways trend, the recent breakout has held so far, and could spill over into other companies in the sector. The key level to watch in the near future is the recently broken $22 level. (For more, see 5 Tech Stocks With Great Earnings.) Tutorial: Basics Of Technical Analysis | 
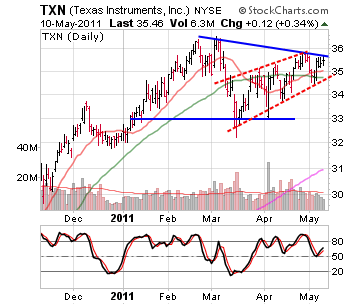
| | Source: StockCharts.com | Another large semiconductor stock that could be close to breaking an important resistance level is Texas Instruments Incorporated (NYSE:TXN). On longer time frames, TXN has actually been outperforming INTC. However, it remains stuck in a base on shorter time frames as it consolidates a rally that occurred late in 2010. While the overall base is ranging from $33 to almost $37, traders are better served watching the price action around $36 and $34.50. The $36 level is where TXN reversed in May and is close to a trendline that has marked the top of the range. TXN has also been following a sub-channel within the base since it rallied off a false breakdown low in March. The most recent low to watch in this channel is near $34.50, which is more important than a simple break of the channel. If TXN drops under this level, it could lead to a retest of the bottom of the base. | 
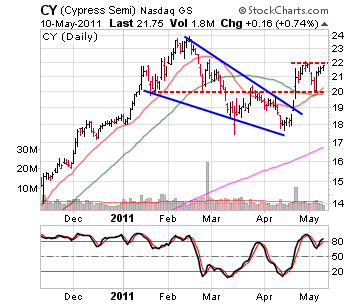
| | Source: StockCharts.com | Cypress Semiconductor Corporation (Nasdaq:CY) is another semiconductor to watch following the strength in INTC. CY cleared an important trendline as it consolidated from its February highs. This trendline was marking the top of a falling wedge pattern CY was following. The stock has since settled into a flag pattern between $20 and $22. A break of this range to either side would be considered significant and certainly worth monitoring. | 
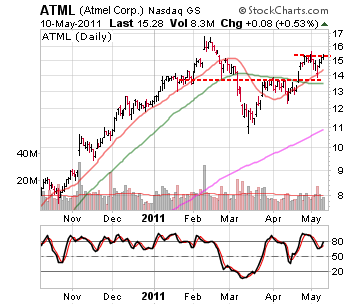
| | Source: StockCharts.com | Atmel Corporation (Nasdaq:ATML) is following a very similar pattern to CY. ATML had been consolidating after more than doubling in price from just November 2010 through February 2011. The pullback was likely a little scary for investors as it accelerated into March. However, ATML quickly stabilized and eventually cleared an important level near $14. It is also trading in a flag; a break to either side of the flag would have very important implications for the stock. (For more, see Atmel Getting Closer To The Sweet Spot.) | 
| | Source: StockCharts.com | The Bottom Line
It’s interesting that many of the semiconductor stocks are still working on consolidations despite the strength in INTC. This is also interesting because they were outperforming the chip giant over the past several months. However, much of the consolidation looks constructive and many of the semiconductor stocks are now testing important levels. If INTC continues to show strength, it could help instill confidence in the group and lead to breakouts above these levels. The key will be to watch how the semiconductor stocks deal with these levels in the coming days. (For more, see ON Semiconductor Getting Bigger And Better.) |


0 komentar:
Posting Komentar