The Weekly Report For May 16th - May 20th, 2011 Commentary: The markets traded sideways all week, alternating between up days and down days. By the end of the week, the major indexes were very close to their starting price, basically signaling consolidation. While there has definitely been some distribution, the markets have basically been flat over the past three weeks after breaking out above resistance in April. So far, the markets remain above their April breakout level despite what has seemed like persistent selling. Next week will likely see an attempt at clearing this range in one direction or the other as the markets reveal their intent. Tutorial: Basics Of Technical Analysis The chart for the S&P 500, as represented by the S&P 500 SPDRS (NYSE:SPY), is showing the pull back to the breakout level pretty clearly. Buyers stepped in just under $134 last week and those levels held once again. However, the Friday close was weak, and SPY could test this level early next week. Last week's low was right at $133; a break below this level would certainly get me nervous, but there is also an unfilled gap between $131.35 and $132.79 that may bring in buyers on weakness. In short, caution is certainly warranted at this point, but full-blown panic is not. | 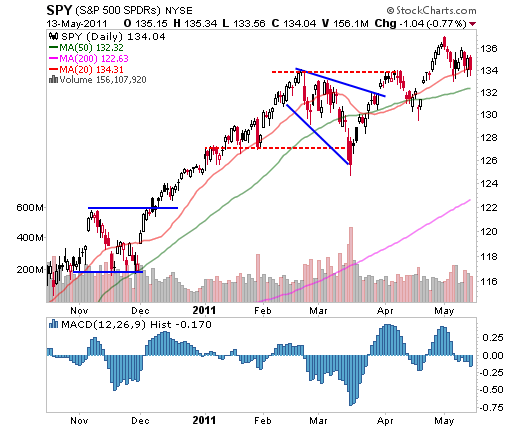
| | Source: StockCharts.com | The Diamonds Trust, Series 1 (NYSE:DIA) ETF remains in a better position due to remaining well above its prior base despite the recent volatility. Last week’s low will be important to watch, but the key level for support remains near the top of the prior range at approximately $124 and down through its unfilled gap at $122.49. This also happens to be around its 50-day moving average, which is also likely to attract buyers. | 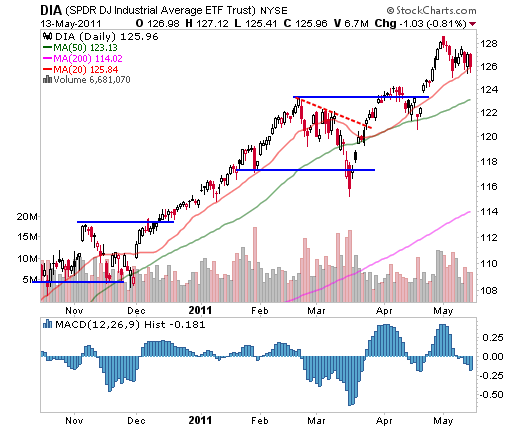
| | Source: StockCharts.com | The Friday close on the Powershares QQQ ETF (Nasdaq:QQQ) was among the worst for the index ETFs, but much like its peers, QQQ remains above its prior base. Despite the day-to-day volatility, QQQ has been trading in a one-point range for more than three weeks. The technical picture for QQQ remains positive and will likely remain that way as long as it stays above the reverse head and shoulders base it cleared in April. | 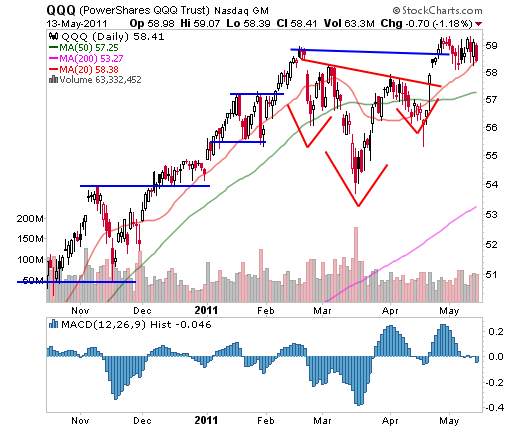
| | Source: StockCharts.com | Despite what looks like a different chart, the iShares Russell 2000 Index (NYSE:IWM) ETF is in much the same pattern as the other index ETFs. IWM remains above its prior base and has been trading sideways. However, it is very close to breaking down, and certainly needs to be watched. Unlike the other index ETFs, IWM already filled its breakaway gap from April; a drop below last week's lows just under $82 would likely signal a much deeper correction. | 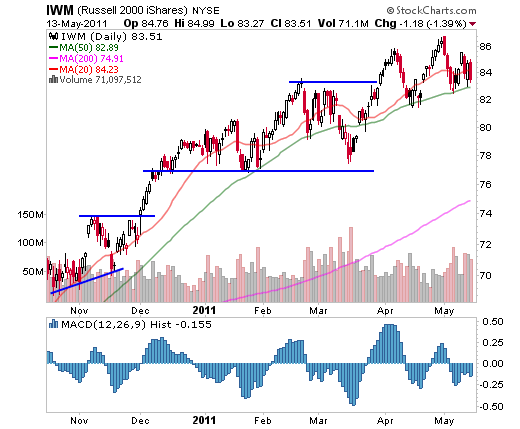
| | Source: StockCharts.com | The Bottom Line
With the recent volatility and underlying weakness, it has been easy to get consumed with fear of a correction. While this can’t be ruled out, the markets really haven’t done anything other than consolidate. Commodities have been hit pretty hard, and that may be providing a clue, but until the markets lose key support levels it is important for traders to remain patient and avoid panic. Traders who have a well-defined trading methodology should simply stick to it until market conditions warrant otherwise. If your methodology includes a way to stop out on weakness, stick to it and remain patient as the markets work through this volatility.
Use the Investopedia Stock Simulator to trade the stocks mentioned in this stock analysis, risk free!
Read, learn, discuss, and share all about trading at TradersLaboratory (TL), the leading online trading forum for day traders, swing traders, and active investors |


0 komentar:
Posting Komentar