The Weekly Report For May 9th - May 13th, 2011 Commentary: We mentioned last week that the markets were vulnerable to a shakeout after the near-vertical rise from the past two weeks, and shake out they did. After news of Osama Bin Laden's death induced a gap higher on Monday, the markets reversed and headed lower all week. Friday did see a gap higher following a better-than-expected jobs report, but the markets eventually gave up a large part of those gains. Commodities were hit hard this week too, as silver and oil were decimated. Part of our concern the past few weeks was that the markets were overbought on short-term indicators, but by the end of the week, many of these indicators were at oversold readings. The McClellan Oscillator was under -150 and approaching levels associated with bounces. Tutorial: Basics Of Technical Analysis The S&P 500, as represented by the S&P 500 SPDRS (NYSE:SPY), experienced a sharp drop from multiyear highs, but essentially pulled back to its 20-day moving average and the top of its prior base. While this is typical post-breakout behavior, it also came on an uptick in volume, which warrants caution. Buyers did step in just under $134, and this week's lows are the immediate area worth monitoring. A break under this level could lead to a push toward the 50-day moving average and possibly toward $130. | 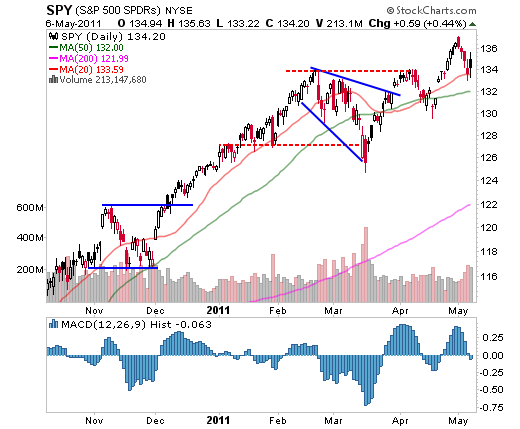
| | Source: StockCharts.com | The Diamonds Trust, Series 1 (NYSE:DIA) ETF also reversed from multiyear highs toward its 20-day moving average. It held well above its prior base and remains in decent technical shape. While this week's low will be important to watch, the key level for support remains near the top of the prior range at approximately $124. It may take several days for the markets to absorb the recent selling pressure, so it is possible that DIA will continue to drift back toward these levels. | 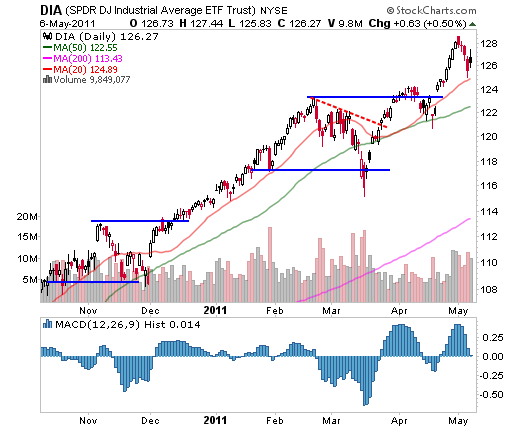
| | Source: StockCharts.com | The Powershares QQQ ETF (Nasdaq:QQQ) had an interesting week as well. Despite the weakness, the ETF fared decently. Buying pressure was evident toward the end of each day as evidenced by the long lower tails in the candles. Also, QQQ never even reached its 20-day moving average, which was a slight positive divergence from the other indexes. While it’s possible that QQQ can continue to back and fill in this area, the current price action has been positive. If QQQ can hold up in this area a little longer, it will likely head to new highs once the markets rebound. | 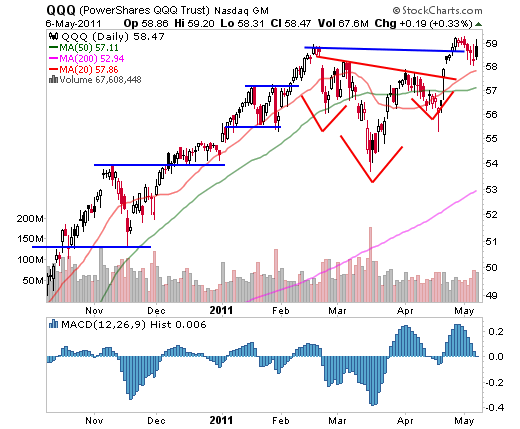
| | Source: StockCharts.com | The iShares Russell 2000 Index (NYSE:IWM) ETF was hit pretty hard this week, and it was the only one of the indexes in this article to pull back all the way to its 50-day moving average. However, IWM is the most volatile of the index ETFs and to a certain extent, the exaggerated moves are expected. IWM continues to hang out near the top of its prior base and while a pullback like this week’s is unpleasant, IWM has done little to damage its longer term trend. The key level to watch is just under $82; a break below this level would hint at a much deeper correction. | 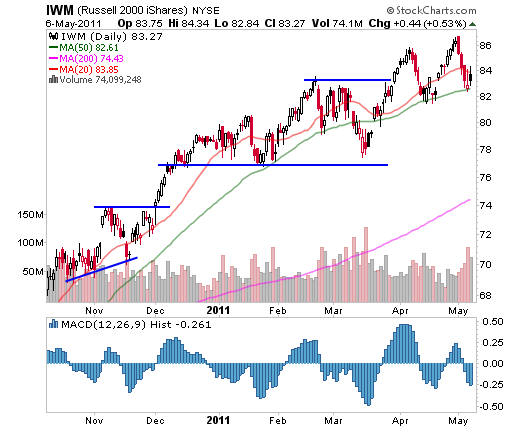
| | Source: StockCharts.com | The Bottom Line
While a pullback was expected and was actually healthy for the markets, it's always difficult to acknowledge in the midst of several weak days. Fear creeps into your mind about whether a top is being formed, and with all the “sell in May” talk, it's easy to let fear impact your trading decisions. The bottom line is that the markets are starting to get oversold and remain in a longer term uptrend. Until the markets start seeing lower lows, it would be risky to assume anything other than a pullback is occurring. In reality, the markets are near a probable support area as they become oversold, and this is usually a good time to look for long setups. This is why we have preached patience over the past week or two. A trader sitting in cash is more likely to scan for opportunity than a trader sitting on severe losses over the past week. The key is to remain patient and be ready to attack the markets once the setups present themselves.
Use the Investopedia Stock Simulator to trade the stocks mentioned in this stock analysis, risk free! |


0 komentar:
Posting Komentar